


 6 / 113

novative products across our portfolio
of financing ventures, catering to the
unique demands of our customers.
As a believer in the solid fundamentals
of the Egyptian automotive market, GB
Auto has valued long-termgrowthmore
than short-term gains. While we antici-
pate the float of the Egyptian pound is a
challenge our business and others will
be managing into 2018, we stand by the
majority of the Egyptian business com-
munity in welcoming the government’s
extensive basket of reforms, seeing
them as the future of the automotive
industry. We believe the finalization
of the Automotive Directive’s pro-local
industry policies are set to support both
local automotive players and national
economic development.
2017 is providing to be challenging. With
higher than usual inventory and debt
levels at the end of 1Q17, in addition to the
200 bps hike in interest rate inMay 2017,
just before the release of this Annual Re-
port, our strategyhas shiftedquite fast to
conduct an inventory and debt reduction
program that would see us return to a
leaner formby the end of the year
I would like to extendmy sincere grati-
tude for all your support throughout
both the challenging times behind us
and the road ahead. We are under no
false assumptions that the journey
forward will be without bumps in the
road, but stand rooted in our belief that
companies like GB Auto who weather
the storm now, will reap substantial
rewards as we roll out new products,
technologies, and partnerships that
will both boost customer satisfaction
and maximize value for shareholders.
Dr. Raouf Ghabbour, CEO
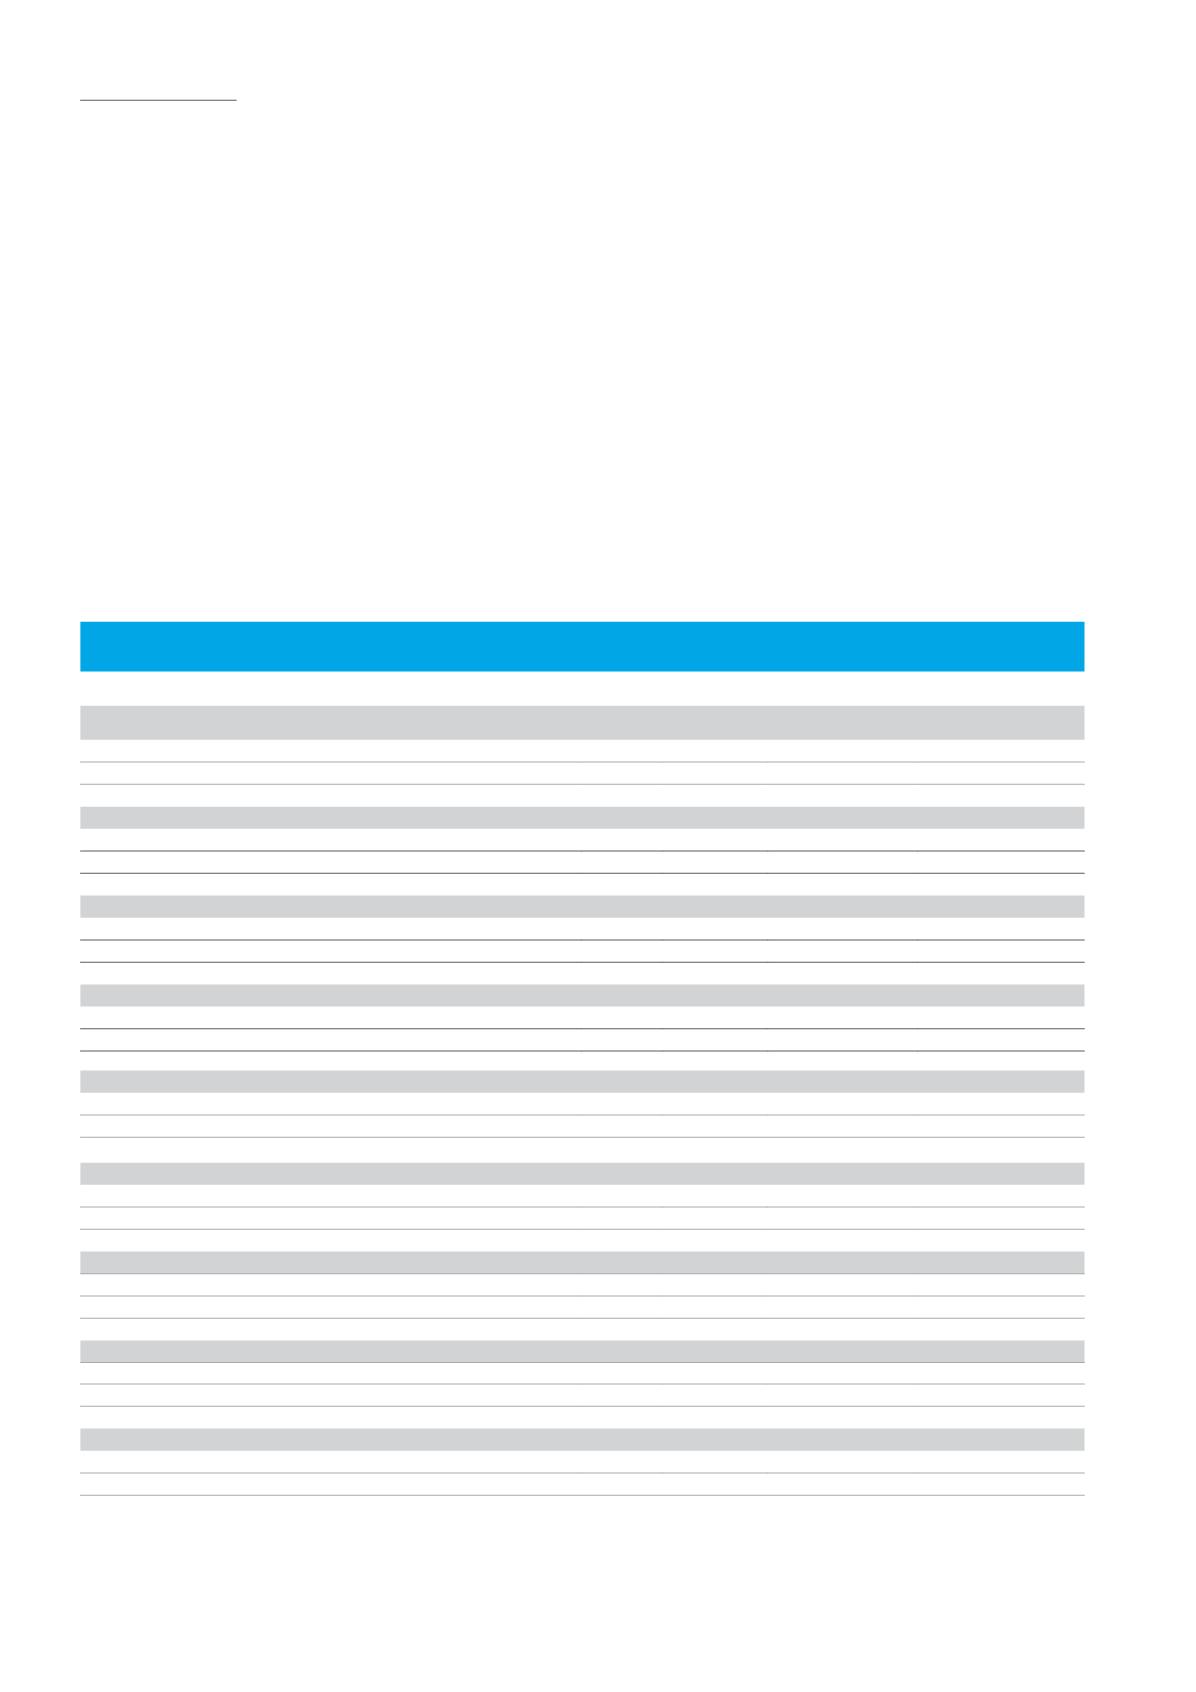
Summary Overview of Performance by Line of Business*
(LEmillion)
2016
2015
Change
Egypt PassengerCars
Revenue
8,016.1
5,713.1
40.3%
Total Gross Profit
942.3
647.9
45.4%
Gross Profit Margin
11.8
%
11.3
%
0.4
EgyptMotorcycles andThree-Wheelers
Revenue
1,708.2
1,892.5
-9.7%
Gross Profit
241.2
328.7
-26.6%
Gross Profit Margin
14.1
%
17.4
%
-3.3
Commercial Vehicles andConstructionEquipment
Revenue
1,113.3
1,216.9
-8.5%
Gross Profit
201.3
167.7
20.0%
Gross Profit Margin
18.1
%
13.8
%
4.3
Egypt Tires
Revenue
462.5
203.2
-
Gross Profit
101.3
27.5
-
Gross Profit Margin
21.9
%
13.6
%
8.4
FinancingBusinesses
Revenue
1,739.6
1,046.2
66.3%
Gross Profit
404.9
233.8
73.2%
Gross Profit Margin
23.3
%
22.3
%
1.0
Egypt After-Sales
Revenue
826.2
569.1
45.2%
Gross Profit
262.0
164.4
59.4%
Gross Profit Margin
31.7
%
28.9
%
2.8
Regional
Revenue
1,201.4
1,544.6
-22.2%
Gross Profit
19.6
25.0
-21.4%
Gross Profit Margin
1.6
%
1.6
%
-
Others
Revenue
218.5
79.0
-
Gross Profit
29.6
9.0
-
Gross Profit Margin
13.5
%
11.3
%
2.2
Group
Revenue
15,285.7
12,264.7
24.6%
Gross Profit
2,202.1
1,603.9
37.3%
Gross Profit Margin
14.4
%
13.1
%
1.3
* All figures provided above are net after elimination of inter-company accounts
2016 ANNUAL REPORT
4
Message From the CEO